
TANGO Partners Perspective – February 2021
Understanding Facebook Metrics
Eric Heineman, Senior Business Development Consultant & Director of Strategic Partnerships
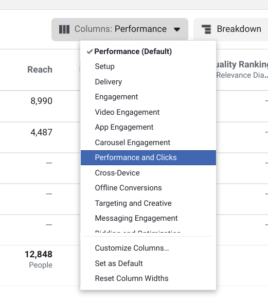 There are many different metrics to measure performance in Facebook Ads Manager, and some of them seem very similar. When advertising on Facebook, many of the metrics that best display the performance of your campaign can be found when adjusting the columns from the default of Performance to Performance and Clicks. The experts here at Cause Inspired have put together a list of metrics that best measure most campaigns.performance and clicks columns option.
Metrics
Reach:
The number of people who saw your Facebook content at least once. This metric is preferred over impressions for measuring Facebook Ad performance because this is based on unique, singular users rather than just the amount of times the ad was displayed on screen. Reach can also be applicable to your organic Facebook posts, Facebook page metrics, and viral content that you create or share. Advertisers can use reach to measure success with different types of content and messaging so you know what your audience is more likely to interact with on an individual scale.
Link Clicks:
The number of people who clicked on your ad and were directed to your website. Generally, Link Clicks can be used to measure the success of an ad or Facebook post if your goal is to drive more traffic to your website. However, it’s important to note that measuring success for this metric encourages users to click off of the Facebook app and onto a different website. If you’re looking for more engagement, followers, comments, or just awareness on Facebook then this metric will not properly measure your campaign’s success.
Clicks (All):
The number of interactions with your ad, such as clicking to read more, commenting, reacting to the post, and more. While this metric might seem misleading, as it includes all interactions with your content as a “click”, it can be very insightful for gauging your ad’s success. If you’re seeing a lot of clicks on your ad but no “link clicks” then that can indicate your call to action needs to be improved or revised. Try looking at the breakdown dimensions of your ad’s primary text to see which copy variations are getting the most clicks but also getting a fair amount of link clicks. This can help you better understand how to optimize your ad’s text and even refine your targeting based on the results.
Unique CTR (Link):
The percent of people who saw your ad and clicked over to your website. Unique clicks divided by unique impressions. This metric is preferred over CTR (All) because CTR (All) includes all actions taken on the ad, including link clicks, Facebook Page views, post reactions or comments, and more. When measuring your link click performance, advertisers are more focused on the rate of link clicks to the website where the desired conversions are located.
Results:
The number of times your ad achieved the desired outcome of your campaign marketing objective, i.e. traffic, conversions, ThruPlays, lead form fills, etc. You can create new results by building events in Facebook tracking pixel. These events can measure registrations on your website, purchases, donations, and even engagement. Be sure to use results as a measurement for success if you want users to take action on your website. You can also change the attribution window for these results so if a user sees your ad and then converts you can know whether your ad influenced their decision.
CPC (Link):
The cost per click on the link of the website attachment and landing page URL. This is a great measurement for evaluating your cost per result if your main goal is to get traffic to your landing page. Use CPC (Link) to influence changes on your ad copy and targeting for the most efficient cost possible and eventually you’ll be able to achieve your ideal return on ad spend.
Frequency: The average number of times each individual has seen your ad. Aiming for a frequency below 3 is ideal because ad fatigue tends to take place once that number increases. Reduce frequency with dynamic ads or by having multiple ad variations for your audience to engage with. This is also a great indicator when evaluating if you’ve exhausted your target audience. \
How High is Too High of a Frequency Rate?
 The frequency rate of a Facebook or Instagram Ad is determined by impressions divided by reach, or rather the total times the ad is displayed divided by the unique individuals who saw the ad. The average frequency rate is around 1 or 2, but varies depending on the audience size and budget. Frequency rate is a good indicator of performance, because it acts as a telling sign of ad fatigue for the audience.
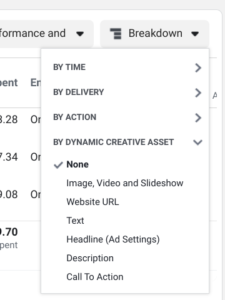
In a Dynamic ad set, the frequency rate is always going to look much higher than it actually is. Break this down to each ad variation to view the actual frequencies of text, image, headline, etc. your audience is seeing. The Breakdown dropdown menu allows you to separate Dynamic Creative Assets by their variations.
There are more metrics that could be of use depending on your campaign, such as Video Views and the measurement of view lengths and engagement, or App Installs and the measurement of installs and engagement.
Getting the most value out of your marketing budget can be tough, get help making your campaigns a success today.
CONTACT OUR
TANGO PARTNER
Eric Heineman
Senior Business Development Consultant
& Director of Strategic Partnerships
Cause Inspired Media
904.429.7575 x117